
Warren Buffett and Goldman Sachs Do Not Think Home Prices Will Fall – What Are They Seeing?
The U.S. housing market is going through a crucial period in 2023, and there are a lot of conflicting opinions about where things are headed. Some believe that the trajectory of home prices over the last few years means we are due for a market correction, while others look at supply and demand data and say there is not a world where home prices will come down anytime soon.
While nobody can predict what will happen in the housing market with 100% accuracy, we can get a good idea by looking at what Wall Street and successful investors are saying and, more importantly, what they are doing.
Goldman Sachs and Berkshire Hathaway Back Housing Market Stability
Ever since interest rates began rising last summer, Goldman Sachs had been unwavering in their prediction that home prices would see double-digit declines in 2023, largely due to decreased demand because of higher interest rates. They even went as far as saying some cities could expect a 2008-style crash.
However, in a recent note to their housing team, their prediction has changed.
We are revising our home price forecasts higher, to 1.8% for full-year 2023 vs. -2.2% prior, and 3.5% in 2024 vs. 2.8% prior. These forecasts imply home prices will remain roughly unchanged through [the] year-end and then return to trend growth levels in 2024.
The U.S. housing market continues to face a severe shortage of homes for sale due to years of underbuilding of new homes and current mortgage rates keeping homeowners from selling their existing homes. According to Redfin, there are nearly 40% fewer homes for sale than before the pandemic. The National Association of Realtors says the amount of existing homes available for sale has fallen 16.6% since July 2022.
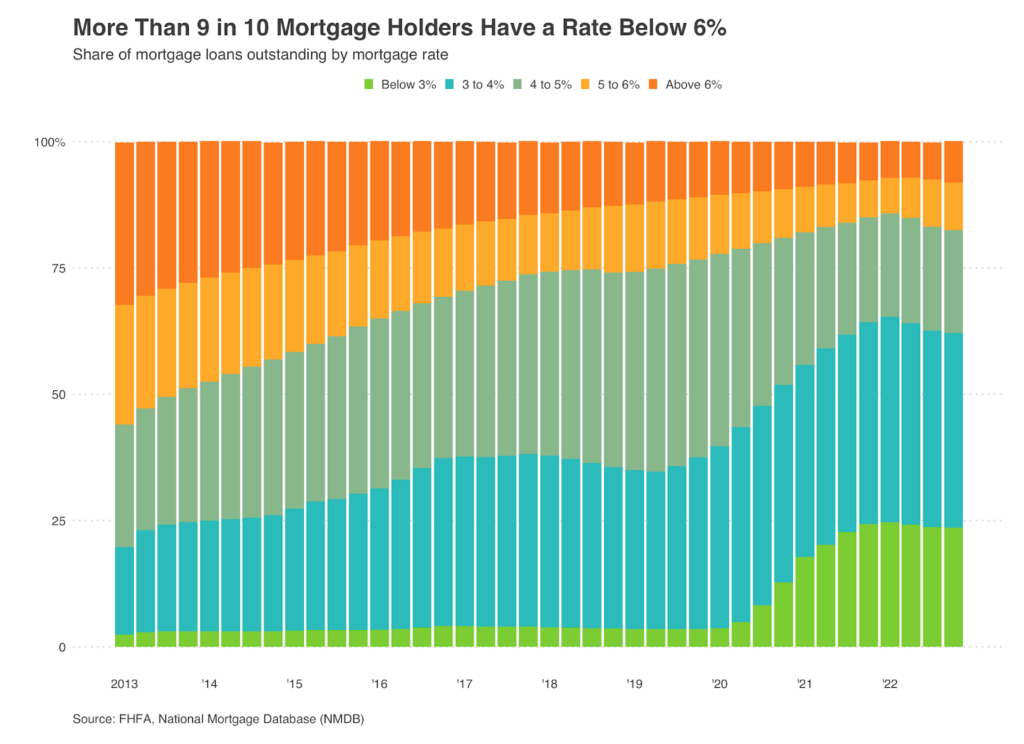
This decrease in the availability of existing homes is solely driven by the rapid rise in interest rates, as homeowners who locked in low rates during the pandemic are either hesitant to take on new mortgages or simply can’t afford a new housing payment at today’s rates. Data from Redfin shows that 91.8% of U.S. mortgage holders have an interest rate below 6%.
Goldman sees that the discrepancy between the number of homes available for sale and the number of people who want to buy them will continue to support home prices for the foreseeable future, and they are not alone in their prediction.
Warren Buffett’s Berkshire Hathaway recently released an SEC Form 13F, which shows its trading actions in the second quarter of 2023. The form indicates that Buffett (through Berkshire) opened new positions in three different homebuilders: D.R. Horton, Lennar, and NVR. The shares are collectively worth $800 million, and their purchase signals that Buffet and Berkshire see the housing market as a good investment.
The shortage of existing home inventory has resulted in a surge in demand for new home construction, which has rebounded significantly in the past year. Overall housing starts increased by 3.9% from June to July.
According to David Auld, CEO of D.R. Horton:
It is hard to pinpoint exactly how underbuilt the country is, but I firmly believe we are still in an extremely undersupplied housing market, for both new and existing homes, likely for years to come due to development and construction capacity constraints in the industry.
Warren Buffet and Berkshire Hathaway know that to meet this demand, homebuilders will need to build a significant number of new properties over the next several years. The need to bridge that gap is combined with the current market conditions to create massive growth opportunities in the homebuilding industry.
Household Completion and Birth Rates Point to Even More Demand for Homes in the Future
Not only do Berkshire and Goldman see the trends that are happening with housing supply, but they also know the demographic trends that will continue to drive demand for years to come.
Demand for homes is measured in “householdsâ€. A household is defined as one or more people living in an individual dwelling unit, such as a family living in a home together, roommates sharing a rental unit, or an individual living alone. Household formation occurs when an individual or a group of individuals move from one household into a separate household.
A report from the Joint Center of Housing Studies shows that annual household growth between 2019 and 2021 averaged between 2.0 million and 2.4 million per year. This level of household growth is above the 1.5-1.6 million per year pace averaged in 2017-2019, and well above the roughly 700,000 per year pace averaged in the decade prior.
We can see why household growth has increased so significantly over the last decade by looking at the demographic data.
According to the National Association of Realtors, the average American homeowner purchases their first home at the age of 33. Between 2006-2012, when household formations were at their lowest, those who were born in 1976-1982 were reaching that first-time homebuying age – and that period saw a significant decline in birth rates.

By following this chart, we can see the population of 33-year-olds in the United States has increased drastically over the last few years. This demographic is significantly contributing to the high demand we are seeing in the market today. Many of these people likely have not even entered the market because of the affordability issue, which means there is a lot of pent-up first-time homebuyer demand just waiting to be unleashed into the market.
As we mentioned above, this surge in demand is coming after a decade-long dip in new homes being built. And while that number has increased recently, it is still not enough to meet the demand coming from new first-time homebuyers.

New households have been significantly outpacing new home completions since 2017. This widening gap between buyers and homes for sale will be more than enough to keep home prices supported for the foreseeable future.
This is already shaping up to be true and profitable for the American homeowner. According to a new Redfin report, the total worth of U.S. homes neared a record $47 trillion in June, surpassing the previous all-time high of $46.6 trillion set in June 2022. These gains have now offset the $2.9 trillion decline in value that occurred from June 2022 through February 2023 due to rising mortgage rates. Black Knight’s August 2023 Mortgage Monitor report tells us the average US homeowner currently has $199,000 in tappable equity.
Record-high home equity is an important statistic to consider if you are worried about another housing crash. One of the big challenges during the mortgage crisis of 2008 was that homes were over-leveraged and there was very little equity available. When the recession came and home prices started to fall drastically, it was a devastating domino effect. Your neighbor was forced to sell their house at a loss, and then you had to sell just as low or lower to compete with them, and on and on it went until home values bottomed out.
That scenario will rarely happen in the future. When you have $199,000 in equity in your home, it is very easy to sell for a profit and avoid foreclosure or a short sale.
Home equity is just one of the variables that illustrates how drastically different our current housing cycle is from the one that preceded the 2008 crash.

There were 8 million job cuts in the years leading up to the housing crash – and there have been virtually none recently. The jobs market has been very steady considering the current economic climate, and today there are over 20 million more jobs than there were 15 years ago. A healthy jobs market means stable and often increasing income for potential homeowners, leading to more demand for homes.
A big reason the housing market crashed in 2008 is because of the large amount of mortgages being given to highly unqualified borrowers. Mortgage underwriting standards are so strict now that these types of loans are virtually nonexistent. Nowadays, mortgages are only being made to those who have demonstrated the ability to repay the loan. This means that homeowners today are very unlikely to default on their mortgages and add to the supply of homes on the market.
And healthy mortgages aren’t the only thing keeping home supply from rising. In the 5 years leading up to 2008, U.S. builders built nearly 9 million new homes. This was in response to the “fake†demand for homes that the subprime mortgage market created.
Builders today have learned from that mistake. Only 6.45 million homes have been built in the U.S. over the last 5 years, which is a large reason why today we only have 700,000 available homes on the market – 82% less than what was on the market leading up to the housing crash. (Inventory on Market = Active Listings – Pending Sales)
And finally, there are the foreclosures. Foreclosure activity has gone up since mortgage forbearance ended, but the foreclosure rate is still only at .3%. It was almost 15 times that amount in the years leading up to the 2008 crash.
The Bottom Line
Big investors and market analysts know that the high demand for homes and low supply mean residential real estate is a safe investment. Demand for homes will only continue to rise as more buyers enter the market, which will happen when interest rates come down or people simply decide to stop waiting.
Tune out the nonsense you hear in the media about housing – we are NOT on the verge of another housing crash. As home affordability improves, we are going to see new demand unleashed into a market with already low supply. As a result, home values in most areas of the country will continue to rise.